How good are LLMs at tickerization?
A benchmark of flagship LLMs for tickerizing alternative data pipelines.
 ·
·
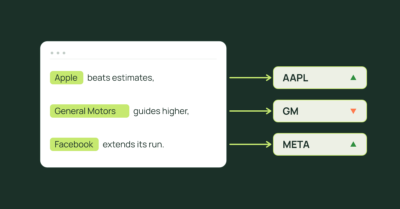
For data to be marketable to investors, it usually must be mapped to asset-level identifiers, commonly known as tickers. An enterprise working to refine its datasets into valuable alternative data (alt data) products typically encounters the tickerization problem: given a body of unstructured data mentioning companies, such as social media posts, transcripts, or articles, extract every publicly traded company mentioned and map it to its standard ticker symbol.
This labeling can be expensive, subjective at the boundary, and quickly becomes stale due to corporate events. To unlock the economic potential of these datasets, labeling in general and tickerization in particular need to be reliable and economic.
We evaluate the performance of the leading commercial models on such problems. We also illustrate a scalable mechanism to generate canonical reference (actual, gold) labels via multi-model consensus. The reference dataset can then be used to evaluate and optimize tickerization pipelines. The approach generalizes to other labeling tasks, allowing alternative data producers to select the optimal point on the price-performance continuum for their specific data product.
Tickerization performance of flagship models
We scored each model’s first-pass labeling (tickerization) against the canonical labels using precision, recall, and F1 metrics. We report averaged metrics (aggregating TP/FP/FN across all documents), which weight ticker-dense articles proportionally.
Flagship commercial model performance against the canonical stock ticker labels:
| Model | Precision | Recall | F1 |
|---|---|---|---|
| Claude Opus 4.6 | 0.967 | 0.944 | 0.956 |
| GPT-5.4 | 0.923 | 0.926 | 0.924 |
| Gemini 3.1 Pro Preview | 0.896 | 0.974 | 0.933 |
| Grok 4.20 Beta | 0.951 | 0.736 | 0.830 |

Claude Opus 4.6 achieved the best overall F1 (0.956) with the highest precision (0.967) and strong recall. Gemini 3.1 Pro Preview posted the highest recall (0.974) but the lowest precision (0.896). Grok 4.20 Beta was the outlier: high precision (0.951) but recall of just 0.736, missing roughly a quarter of canonical mentions.
How the budget models performed
After establishing the reference labels, we sent each article to the four light/fast models: GPT-5.3 Chat, Claude Haiku 4.5, Gemini 3.1 Flash Lite Preview, and Grok 4.1 Fast. This measured the performance of budget tickerization using the leading vendors’ offerings, and is more appropriate for tickerizing large datasets with thousands of documents per day:
Light model performance against the same canonical labels:
| Model | Precision | Recall | F1 |
|---|---|---|---|
| Claude Haiku 4.5 | 0.888 | 0.820 | 0.853 |
| GPT-5.3 Chat | 0.863 | 0.942 | 0.901 |
| Gemini 3.1 Flash Lite Preview | 0.918 | 0.844 | 0.879 |
| Grok 4.1 Fast | 0.898 | 0.918 | 0.908 |

The degradation from flagship to budget model varies by provider. Claude shows the widest gap: Opus at 0.956 F1 versus Haiku at 0.853, a 10-point drop driven by recall loss (0.944 → 0.820). ChatGPT degrades modestly, with GPT-5.3 Chat (0.901) only 2 points behind GPT-5.4, and it achieves the highest recall of any model in either tier (0.942). The most surprising result: Grok 4.1 Fast (0.908) substantially outperforms its flagship counterpart (0.830), recovering 18 points of recall.

The core finding is very important: Given careful design and benchmarking, labeling and tickerization pipelines can achieve the performance of frontier models at a fraction of the cost.
Furthermore, voting across multiple cheap models (ensemble models) can outperform a single expensive one. A four-model light ensemble at ≥2/4 agreement (0.917 F1) beats every individual flagship model except Claude Opus (0.956), and does so at a fraction of the inference cost. We look forward to examining the economics and ensemble performance of the (even cheaper) open-weight models in the upcoming articles.
Each vendor has a personality and a bias
Beyond aggregate F1, the composition of each model’s errors reveals distinct extraction personalities that persist across model tiers.
Gemini is a hallucinator: 82% of its flagship errors are false positives (FP/FN ratio of 4.4:1). It casts the widest net and over-extracts. Claude is the opposite – 64% of its errors are misses, and that ratio holds identically at 0.57 in both Opus and Haiku. GPT-5.4 is the most balanced at a FP/FN ratio near 1.0. Grok 4.20 Beta almost never hallucinates (only 25 false positives versus 174 misses, ratio 0.14) – its low recall is not poor entity recognition but aggressive abstention.
These distinctions matter for pipeline design. If false positives are expensive downstream (for example, leading to trades on incorrectly attributed sentiment), Claude’s or Grok’s conservative profile is preferable. If false negatives are costlier (for example, for litigation risk monitoring where missing a mention has consequences), Gemini or ChatGPT may be a better fit. Detailed understanding and evaluation of models and their tradeoffs are thus critical in constructing pipelines for alternative data products and other predictive datasets. The main use cases in the alternative data space, such as sentiment signals, risk alerts, and data-driven signals, each penalize a different error type, which means the “right” model may be a function of data type as much as a leaderboard.
How we built the reference set: two-pass consensus
The technical details of the pipeline construction and the reference dataset are provided below. The core idea is to treat multiple frontier models as an annotation committee and use supermajority voting to produce reference labels automatically.
What we tested
The benchmark corpus consists of 100 financial articles, each containing at least one mention of a US-listed equity. Articles range from earnings call transcripts to sector commentary, with ticker density varying from 2 to 21 mentions per document. The pipeline restricts extraction to US-listed tickers; foreign listings are excluded. Each article is sent to four flagship models: GPT-5.4, Claude Opus 4.6, Gemini 3.1 Pro Preview, and Grok 4.2 Beta.
Prompt design
Each model receives the full article text with a structured extraction prompt requesting JSON output: an array of objects containing ticker symbol, company name, evidence span, and confidence score (0–1). All models run at temperature 0 for reproducibility.
Ticker normalization
Raw model outputs pass through a normalization layer before scoring. A static alias map consolidates known duplicate listings and share classes to a single canonical symbol (GOOGL to GOOG, BRK.B to BRK.A, NWSA to NWS, FOXA to FOX). Ticker strings are also cleaned: slashes convert to dots, trailing hyphens with single-character suffixes normalize (BRK-B becomes BRK.B before alias resolution), and all symbols are uppercased. A confidence threshold of 0.5 filters out low-conviction extractions.
Labeling rules
In the first pass, each article is independently processed by all four models. Every unique normalized ticker receives a vote count (0–4):
- 3/4 or 4/4 votes: accepted into the canonical label set.
- 2/4 votes: ambiguous—queued for a second pass.
- 1/4 votes: discarded due to likely hallucination or obscure references.
Ambiguous documents enter a second pass: a narrower adjudication prompt presenting only the ambiguous candidates alongside the transcript. Any unresolved records following the second pass are routed to manual review.
The initial sweep processed 100 financial articles through all four models (400 first-pass calls).
First-pass vote distribution across all ticker mentions:
| Vote Count | Tickers | Outcome |
|---|---|---|
| 4/4 (Unanimous) | 462 | Accepted |
| 3/4 (Supermajority) | 119 | Accepted |
| 2/4 (Ambiguous) | 87 | Queued for second pass |
| 1/4 (Singleton) | 156 | Discarded |

Maximizing the effectiveness of your tickerization pipeline
The single most actionable engineering takeaway from this benchmark is structural: decouple extraction from resolution. Use the LLM only for named-entity recognition (NER) on company mentions; resolve those mentions to canonical ticker symbols against a maintained reference table rather than asking the model to guess. Most inter-model disagreement we observed was not a recognition failure — it was a resolution failure. A model knew the company was mentioned but assigned the wrong symbol, an outdated symbol, or a foreign listing of an issuer with a US-listed counterpart. A reference table eliminates that entire class of error and produces a strict performance uplift for any pipeline.
The reference table and pipeline only does its job if it’s point-in-time. To a buy-side research team, a ticker map that isn’t point-in-time is a source of systematic bias. Tagging a 2022 mention of VMware as AVGO, its post-acquisition rollup, introduces lookahead bias. Dropping delisted or bankrupt issuers from today’s table introduces survivorship bias. Quant research teams won’t sign off on analysis that runs over a ticker mapping they can’t verify as point-in-time.
Conclusions
Multi-model consensus is a viable alternative to manual labeling for generating benchmark data. The approach is reproducible, auditable, and re-runnable as new models ship.
Model choice matters more than model tier. The best light model (Grok 4.1 Fast, 0.908 F1) outperforms the worst flagship (Grok 4.20 Beta, 0.830, curiously, from the same vendor) by a wide margin, and a four-model light ensemble surpasses most flagship models individually. Production pipelines should evaluate specific models empirically rather than assuming flagship pricing buys flagship performance.
Each provider has a distinct error signature: Gemini over-extracts, Claude under-extracts, GPT is balanced, and these profiles are consistent across model tiers. The right model depends on whether your downstream use case penalizes false positives or false negatives more heavily.
The dominant source of inter-model disagreement is not entity recognition but ticker resolution. Alternative data pipelines that decouple extraction from resolution: use the LLM for NER, then resolve against a maintained reference table rather than asking the model to guess the symbol, can expect a performance uplift.
vBase builds and runs point-in-time tickerization pipelines as a managed service for data providers and quant funds. If you’re building or using data products for investors, request a demo or email contact@vbase.com
Related research from vBase
- Your LLM’s alpha might be mere memorization
- If data is oil, AI is the shale revolution
- Why alternative data trials fail
Shunran is a recent graduate of Cornell University’s Master of Financial Engineering program. Her work focuses on quantitative research and systematic investing, using alternative data and machine learning to generate tradable signals. At vBase, she developed portfolio strategies using sentiment data, and built LLM-based tickerization pipelines.